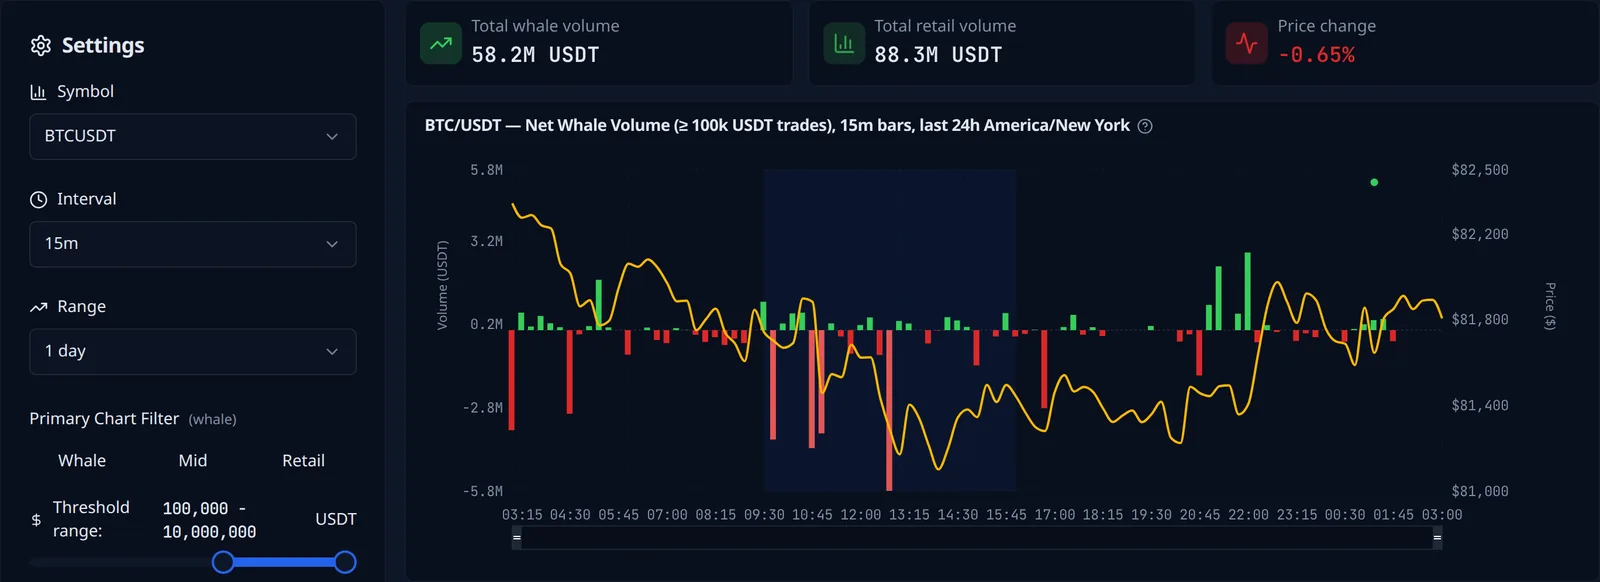
What is order flow in crypto?
Every trade on an exchange has a buyer and a seller. A candle sums all of them up into four prices: open, high, low and close. It shows the result, but not the fight behind it.
Order flow looks at the trades themselves. For each bar you see how much was bought, how much was sold, and the difference between the two, called delta. A green candle with strong positive delta is a move backed by buying. A green candle with negative delta is a move that buyers are not supporting.
Why split order flow by trade size
A single delta number mixes everyone together: a fund moving a million dollars and thousands of small accounts buying a few hundred each. When they disagree, the total can look flat while two very different things happen underneath.
FlowGlow separates the flow before it adds it up:
- Whale flow: trades of 100,000 USDT or more.
- Retail flow: trades of 10,000 USDT or less.
- Mid-size flow: everything in between.
You can move these thresholds with the sliders in the app. The crypto whale tracker page explains the size groups and how to read whale vs retail charts in more detail.
Cumulative volume delta, for whales and for retail
Bar-by-bar delta is noisy. Cumulative volume delta (CVD) adds the bars up, so a steady stream of selling shows as a line that keeps going down, even when no single bar stands out. In FlowGlow, switch on Cumulative and both charts turn into CVD: one for whales, one for retail.
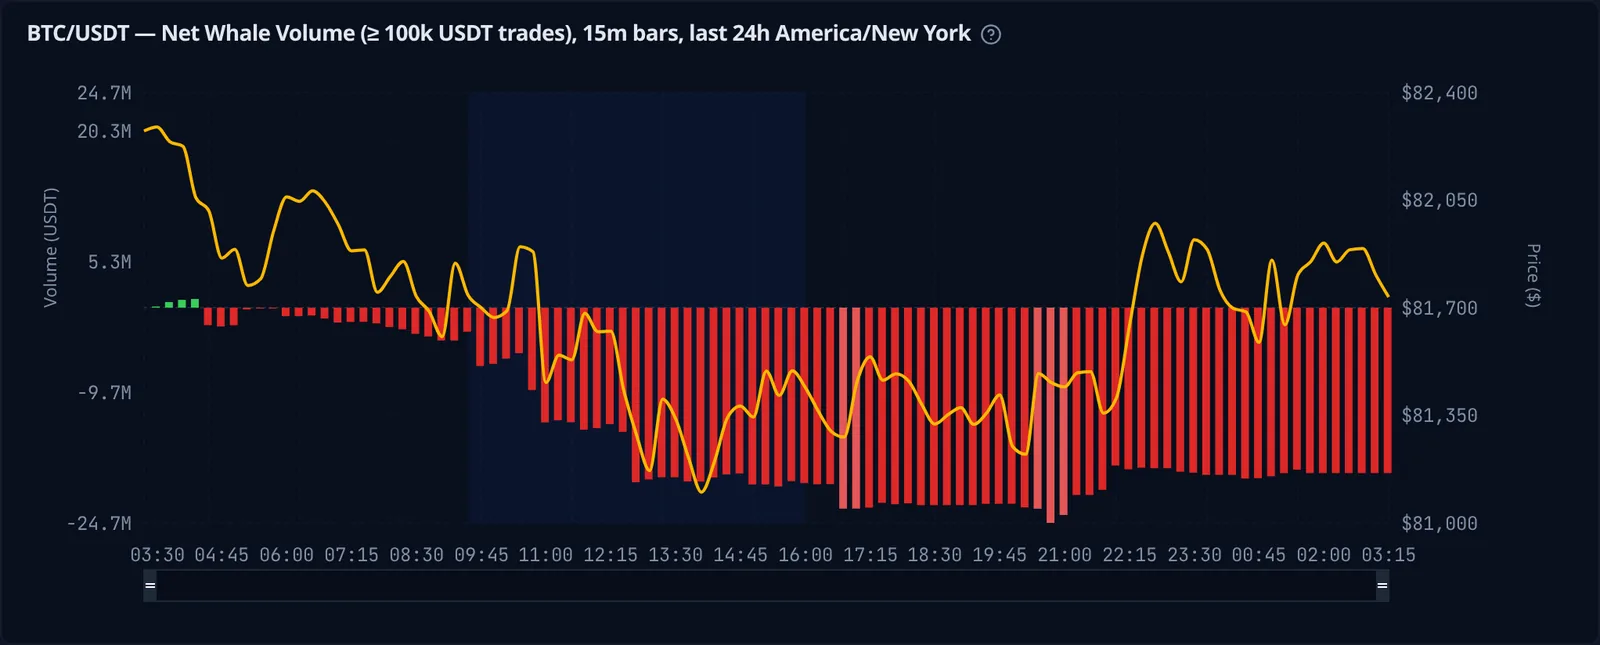
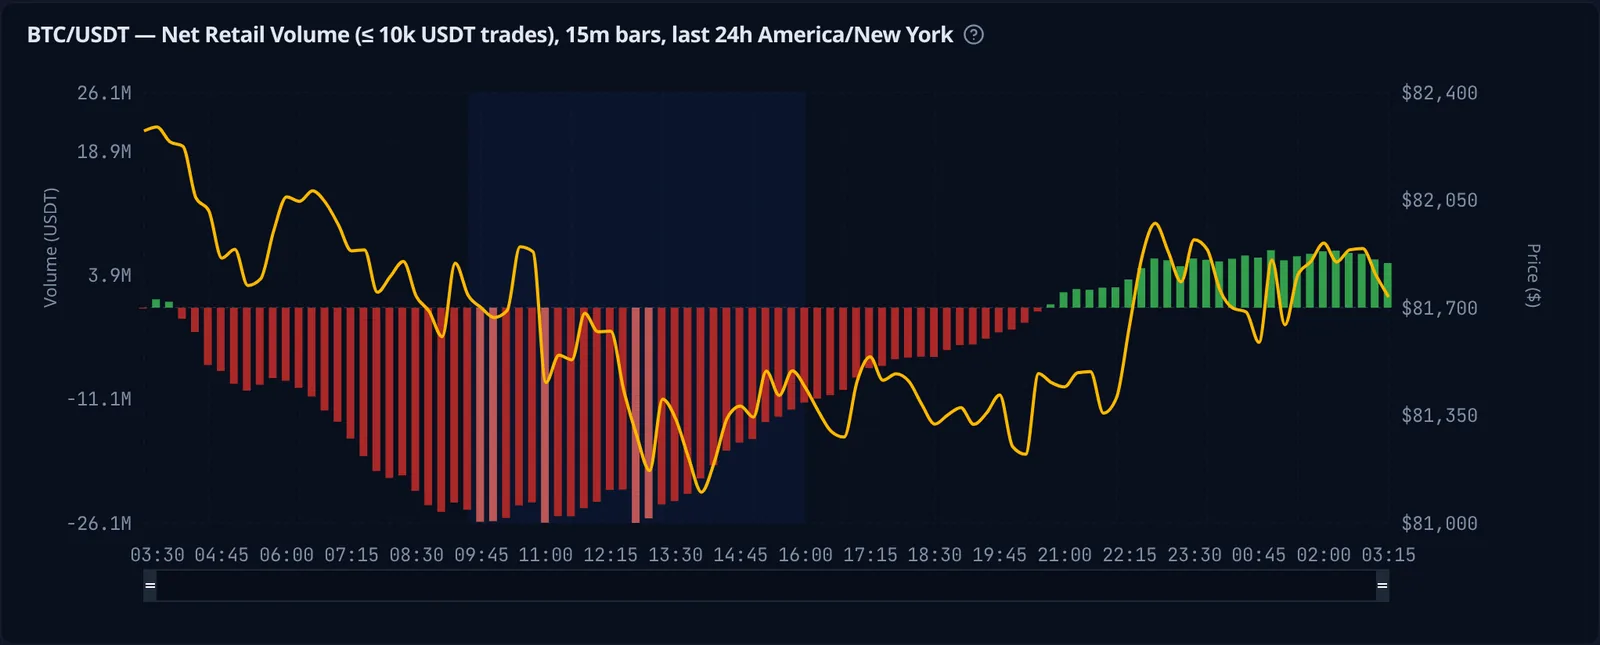
Put the two side by side and the day reads differently than the price chart alone. Whales were net sellers almost all day, with the heaviest selling during the US session. Retail sold in the morning too, then bought steadily from midday and finished in positive territory. The bounce late in the evening came with retail buying, while the whale total barely moved.
Reading order flow next to price
Both charts carry the price line, so the useful patterns are where flow and price disagree:
- Price up, whale delta down. The rally is not backed by large buyers. Large traders may be selling into it.
- Price down, whale delta up. Large buyers are absorbing the selling, which can come before the price stops falling.
- Whales and retail in opposite directions. FlowGlow can highlight these divergences on the chart, so you don't have to compare bars by eye.
- Session timing. Session overlays show when the flow happens, for example whether the largest whale trades cluster in the US session (9:30 to 16:00 New York time).
Order flow on Ethereum
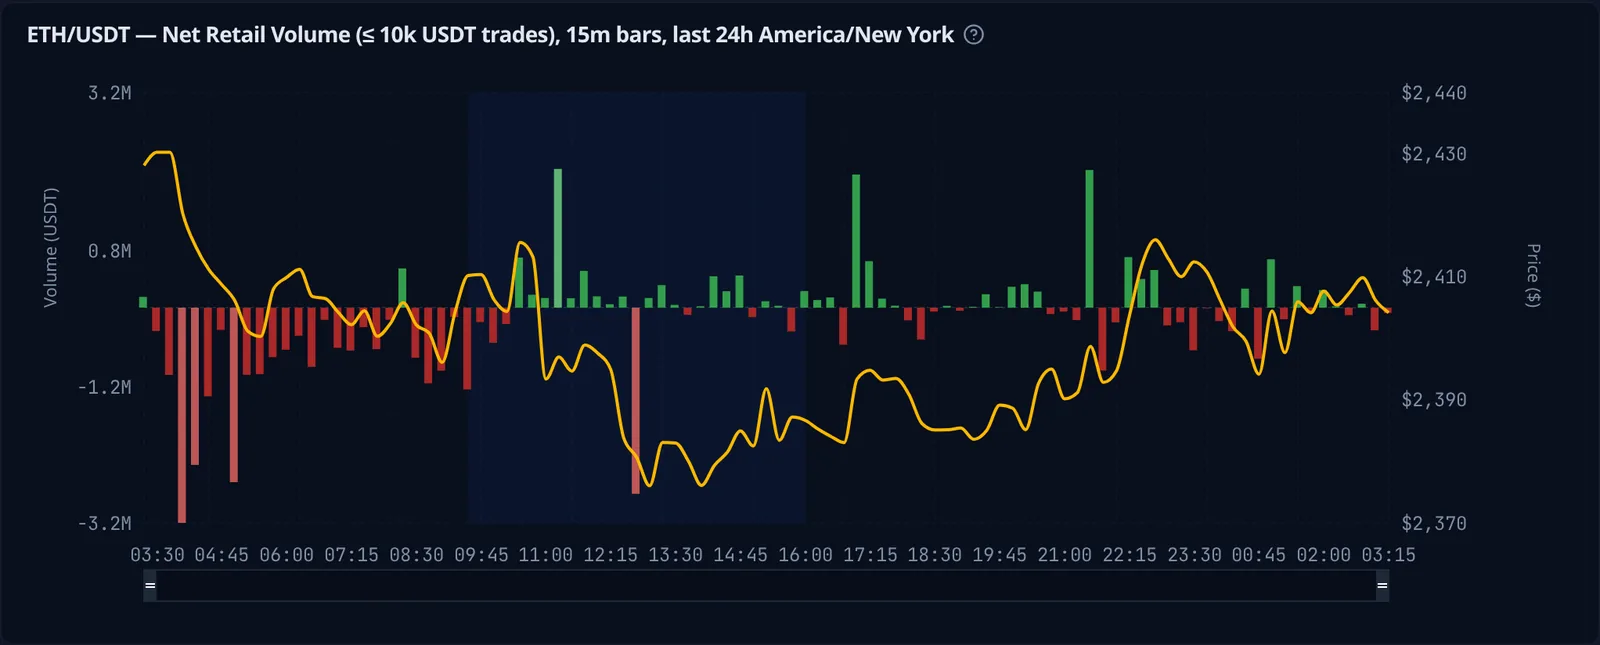
Everything above works the same for ETH/USDT. Pick the symbol in the settings panel and both charts switch over, with the same size groups, cumulative mode and sessions.
A free crypto order flow tool for BTC and ETH
- Whale, mid and retail order flow for BTC/USDT and ETH/USDT spot
- 15-minute and longer bars, refreshed while you watch
- Bar-by-bar delta and cumulative volume delta
- Adjustable trade size thresholds for each chart
- Divergence highlight and trading session overlays
- PNG and CSV export of the charts